
State Transition diagrams describe the logical transition of a system through various states of operation by representing states, the transitions that connect them, and the events that trigger transitions. The implementation aligns with the SysML representation.
The State Transition diagram is available for entities in the State class.
The State Transition diagram is a free-form diagram.GENESYS begins with a simple layout for the nodes but offers several layout options to choose from. Then you can customize node positions as desired. Individual lines can be repositioned as well. Drag the handle at the connection point with the node to control where the line connects to the node. Drag a handle at a bend in the line to move that line segment. Individual labels can be resized and moved along the lines.
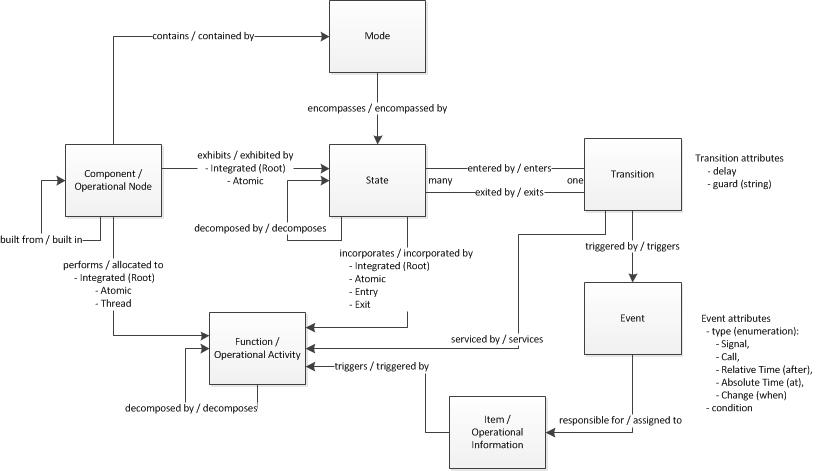
States are an orthogonal approach to looking at the behavior of a system. Some systems are well suited to a state transition representation, and many individuals naturally think this way. Other systems are well suited to a behavioral representation, and many naturally think in this pattern. Ultimately, it's up to the team and the individual whether to use state, behavior, or both in their analysis and modeling. If both are used, then states, their transitions, and the related events are higher-level concepts that are realized by behavior. A view of how states and transitions fit into the greater language of MBSE is shown below.
For the state transition diagram:
-
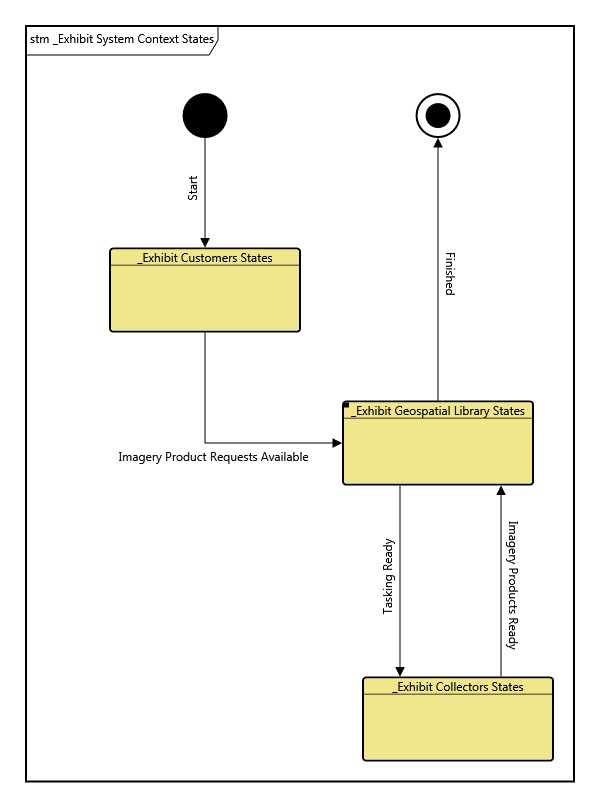
The state transition diagram is opened on a State or a component / operational node with a root state. The diagram is a single-level diagram which displays all of the child states as rounded rectangles.
-
The lines between states are Transitions. Transitions are directional, exiting from one state and entering another. While states may have multiple transitions, transitions are limited to a single entry and a single exit.
-
Transitions are triggered by Events and serviced by Functions / Operational Activities. Though it is possible to display Transition information on the transition line using the connection icon profile, most commonly the transition information is not shown. Instead, the information displayed is some combination of the following:
-
The triggering event(s);
-
Events of type Call are written in the form EventName (condition), and the parentheses are written even if the condition is empty;
-
Events of type Signal are written in the form EventName (condition), but the parentheses are not written if the condition is empty;
-
Events of type Change are written in the form when condition;
-
Events of type Absolute Time are written in the form at condition;
-
Events of type Relative Time are written in the form after condition;
-
The guard condition shown in square brackets;
-
The function which services the transition (preceded by a /).
-
-
The state nodes themselves can optionally display the entry, exit, and do (root) functions related to them.
|
NOTE: |
A good reference for further information on state transition diagrams is chapter 11 of A Practical Guide to SysML: The Systems Modeling Language by Sanford Friedenthal, Alan Moore, and Rick Steiner (2012). |
Diagram Options
In addition to the classic diagram options, the state transition diagram settings include:
-
Use Orthogonal Lines - controls whether orthogonal lines or direct lines are used to connect nodes on the diagram.
-
Show State Behaviors - determines whether entry, exit, and do (root) functions related to the state are displayed on the state.
-
Show Triggering Events - determines whether the triggering events are shown as part of the transition label.
-
Show Guard Conditions - determines whether the guard conditions are shown as part of the transition label.
-
Show Effects - determines whether the transition effects are shown as part of the transition label.
Diagram Toolbox
The constructs and key entities tabs allow you to quickly develop your use case model, while the all entities tab enables you to relate your state transition model to the remainder of your system definition.
Constructs
-
New State - drop onto the diagram background or any diagram node to create a new state as part of the node composition (decomposed by)
-
States - drop onto the diagram background or any diagram node to relate an existing state as part of the node composition (decomposed by)
-
New Entry Transition - drop onto any diagram node to create a new transition as part of the node entry transitions (entered by)
-
Entry Transitions - drop onto any diagram node to relate an existing transition as part of the node entry transitions (entered by)
-
New Exit Transition - drop onto any diagram node to create a new transition as part of the node exit transitions (exited by)
-
Exit Transitions - drop onto any diagram node to relate an existing transition as part of the node exit transitions (exited by)
-
New Event - drop onto any diagram transition line to create a triggering event (triggered by)
-
Events - drop onto any diagram transition line to relate an existing event as a triggering event (triggered)
Utilities
-
Image - drop onto the diagram to insert a new picture
-
Note - drop onto the diagram to insert a new note (descriptive text in a note icon)
-
Shapes - drag one of the shapes from the toolbox and drop onto the diagram to insert a new shape
Key Entities
-
Event - drop an existing event onto a transition line to establish any valid relationship. Most often, this will be triggering (triggered by)
-
Function - drop an existing function onto a transition line to establish any valid relationship. Most often, this will be a servicing relationship (serviced by)
-
State - drop an existing state onto the diagram background or a node to establish any valid relationship. Most often, this will be composition (decomposed by)
-
Transition - drop an existing transition onto a node to establish any valid relationship. Most often, this will be entry or exit (entered by / exited by)
All Entities - all classes and entities in the system model, allowing you to drag any entity on top of a diagram node to establish relationships with the balance of your system model
Context Menu Commands
Tips and Tricks
-
In general, it is better to move nodes first and then reposition lines and labels as desired. Otherwise, as you move nodes, the connecting lines will shift as well, potentially forcing you to then manually reposition the line or label.
-
Once you get the nodes in place use the Transform command Line Routing >> Route All Lines Orthogonally or select the lines that are not correct and use Line Routing >> Route Selected Lines Orthogonally.
-
Using a diagram shape in conjunction on block diagrams is a good way to graphically indicate clusters.
-
If you wish to show state behaviors, ensure that the node template is set to State Transition Node. This node template contains specialized logic required to display state behaviors.
-
The lines on a state transition diagram represent first class entities. You can drag-drop these entities onto nodes to connect them, or you can drag-drop nodes onto the line. Remember that just dragging an image moves it. To drag-drop, hold down the control key while dragging or right-click and drag.
-
Ensure that the line template is set to State Transition Line to see the standard information. This node template uses specialized logic required to show Event and Function information. Other node templates will show information based on the Transition entity.