N2 Diagram

The N2 (pronounced "N-squared") diagram represents the logical data flow for a system or system segment. Part of the behavioral (logical architecture) representation set, the N2 diagram displays the data dimension of the behavior model and helps focus attention on this subset of the model. In particular, this is helpful in partitioning and allocating the system behavior to manage internal and external interfaces.
The N2 diagram is available for entities in the Function class (as well as any other subclasses of ProcessingUnit).
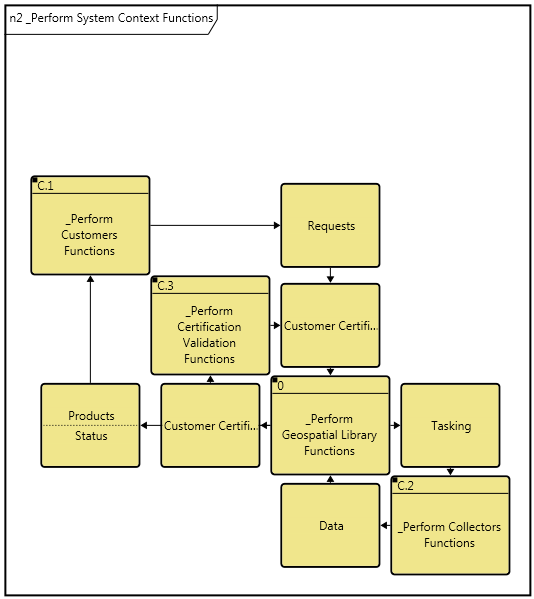
On a functional N2 diagram, the subfunctions are shown on the main diagonal forming an N x N matrix of cells. Items that are output from a function are shown in the function's row. Items that are input to or trigger a function are shown in the function's column. If multiple items are output from and input to / trigger the same pair of functions, multiple items will be shown in the same item cell. If no items are exchanged between a pair of functions, the item cell will be empty.
GENESYS' N2 diagram has been extended to display external inputs and outputs which represent external interfaces for this function. Items appearing in the top row are inputs / triggers for the function that either (i) are output by a function not displayed on this diagram or (ii) are not output by any function at all. Similarly, items in the right-hand column are outputs that are either (i) input to / trigger a function not displayed on this diagram, or (ii) are not input to / trigger any function in the system model. This extension of classic N2 diagrams provides valuable context but can be toggled off, as desired.
A functional N2 diagram displays only the inputs, triggers, and outputs at that level (inputs, triggers, and outputs lower in the decomposition are not displayed). However, the decomposition of functions is considered when placing an item in a cell. For example, if an item is output from Function ABC and input to a descendant of Function XYZ, the item will be shown connecting Function ABC and Function XYZ rather than being shown as an external output.
|
NOTE: |
The order of functions on an N2 diagram is computed by traversing the structure of the parent function (as shown graphically in an activity diagram or EFFBD). The structure is traversed left to right with parallel and select constructs traversed one branch at a time. |
Toolbox Properties
In addition to the classic diagram options, the N2 diagram settings include:
-
Show External Nodes - controls whether items that are external are shown
-
Use Grid Representation - controls whether a matrix layout should be used in place of the traditional node and connecting line representation.
Toolbox Insert
The constructs and key entities tabs allow you to quickly develop your N2 diagram, while the all entities tab enables you to relate your functions and items to the remainder of your system definition.
Constructs
-
New Child - drop onto the diagram to add a new child node to the diagonal
-
Children - drop onto the diagram to add an existing child node to the diagonal
-
New Input - drop onto any function node to create a new item as an input (inputs)
-
Inputs - drop onto any function node to add an existing item as an input (inputs)
-
New Trigger - drop onto any function node to create a new item that triggers the node
-
Triggers - drop onto any function node to relate an existing item that triggers the node
-
New Output - drop onto any function node to create a new item that is output from the node
-
Outputs - drop onto any function node to relate an existing item that is output from the node
Utilities
-
Image - drop onto the diagram to insert a new picture
-
Note - drop onto the diagram to insert a new note (descriptive text in a note icon)
-
Shapes - drag one of the shapes from the toolbox and drop onto the diagram to insert a new shape
Key Entities
-
Component - drop an existing component onto a function to relate it to the node using the performs relation
-
Function - drop an existing function onto the diagram background to it as part of the diagram decomposition (decomposed by)
-
Item - drop an existing item onto a function node to relate it to the node using the input to, triggers, or output from relation
All Entities - all classes and entities in the system model, allowing you to drag any entity on top of a diagram node to establish relationships with the balance of your system model
Context Menu Commands
-
Arrange
-
-
Submenu listing entitied
-
Tips and Tricks
-
When using the default order for the function order, items above the diagonal classically represent feed-forward in your system logic. Items below the diagonal represent feedback.
-
One of the classic uses of an N2 diagram is clustering analysis as an input to your allocation and packaging decisions. Using a diagram shape in conjunction with the traditional (non-grid) layout is a good way to graphically indicate clusters.
-
The grid representation of an N2 diagram is not the classic systems engineering representation, but it may be better understood by non-systems engineers. In addition, the grid representation provides more space for icon labels.
-
Since item nodes on an N2 diagram can represent multiple items, occasionally there will be more items in a node than can be displayed. Double-clicking on an item node presents a pop-up list of all items represented by the node.