Rule Set Diagram Legends
GENESYS has the capability to add automatically-generated legends based on Rule Sets to diagrams. These legends explain the rule-based formatting of the diagrams. The formatting rules can apply to the entire diagram, all of the nodes/lines/other items in the diagram, or to specific nodes/lines/items in the diagram.
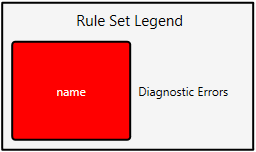
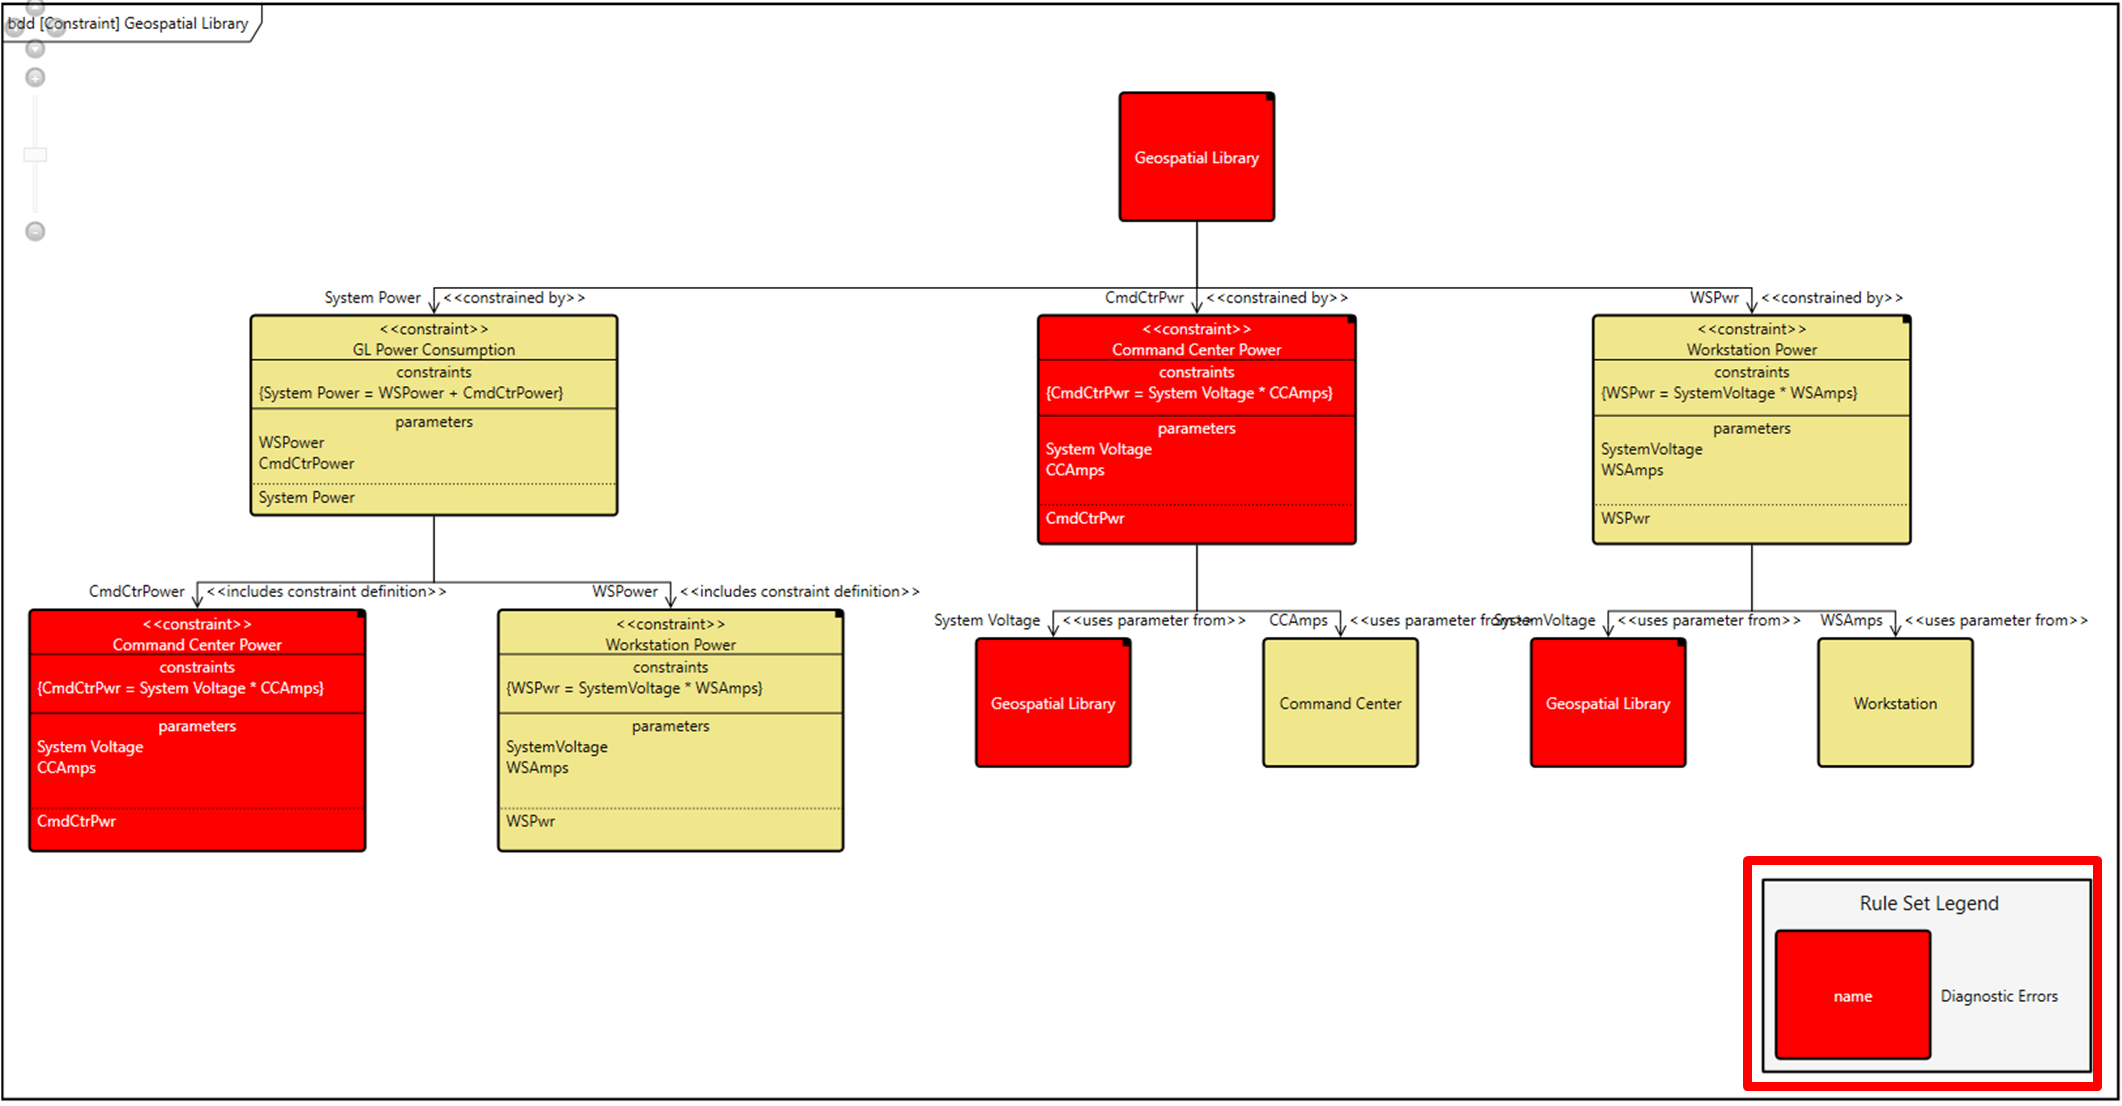
These legends add an enormous amount of meaning to the diagrams through visual classification cues, as shown below. At a glance, you can tell that all red blocks on the diagram are diagnostic errors.
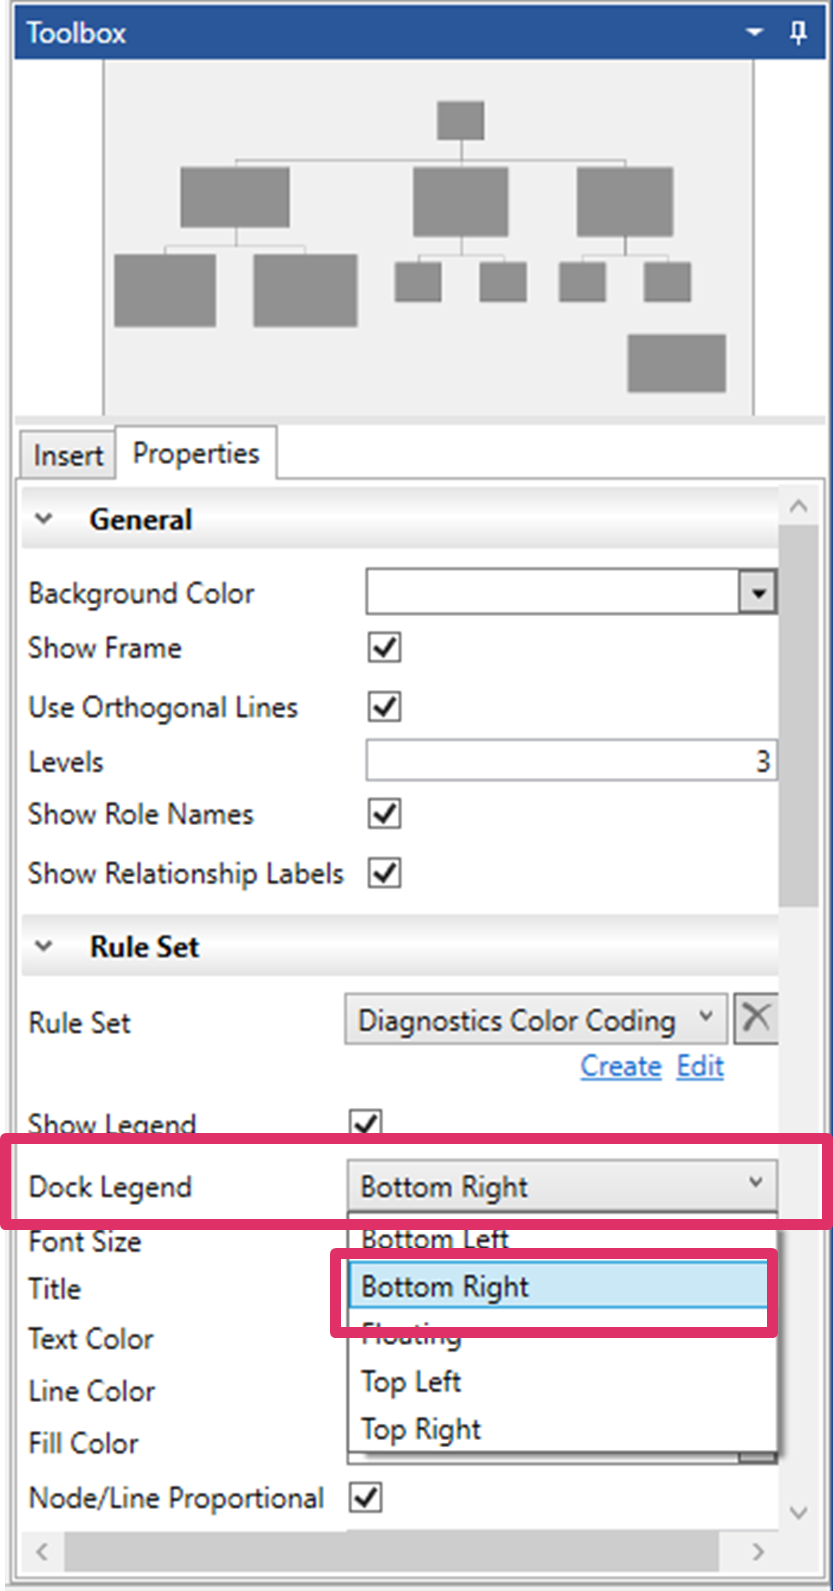
Users also have the option to set many other properties of the rule set legend in the Properties tab of the diagram toolbox or in Project Preferences, including font size, text/line/fill color, node/line/label width, and node height. Additional options include adding a title to the legend, making the labels the same width as the nodes, and proportionally sizing the nodes and lines. The local settings in the Toolbox override the global settings in Project Preferences.
To add a rule set legend to a diagram, you must first select Show a Legend when creating the associated rule set and then check Show Legend in the diagram toolbox properties.
By default, the legend is placed on the bottom right side of the diagram, although users can re-position it by selecting another option (bottom left, floating, top left, or top right) from the Dock Legend drop-down list in the Properties tab of the diagram toolbox. Users can also drag-drop the legend any place on the diagram.
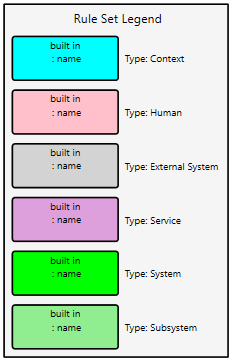
Another example is shown below. The rule sets that apply to this diagram display the node types in various colors.
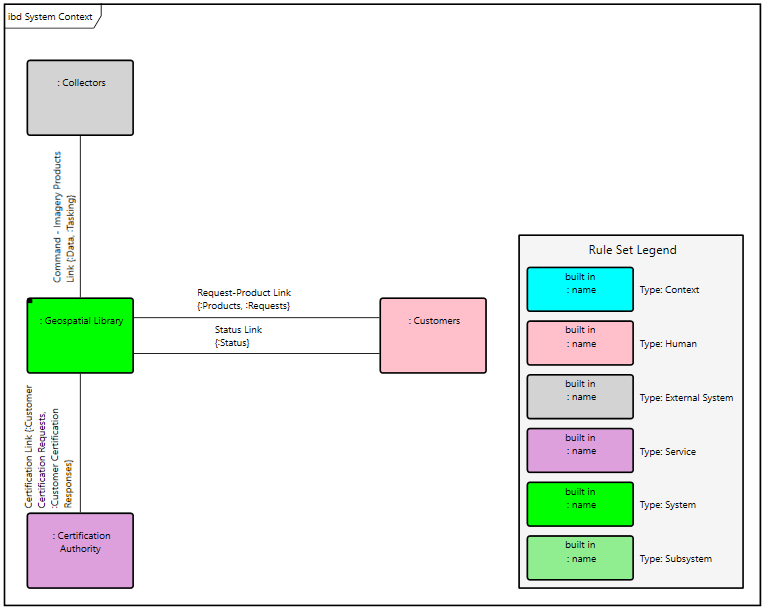
The diagram legend shows at a glance that purple nodes are services and green nodes are systems and subsystems.